RAG Viz added to covid-stats.de
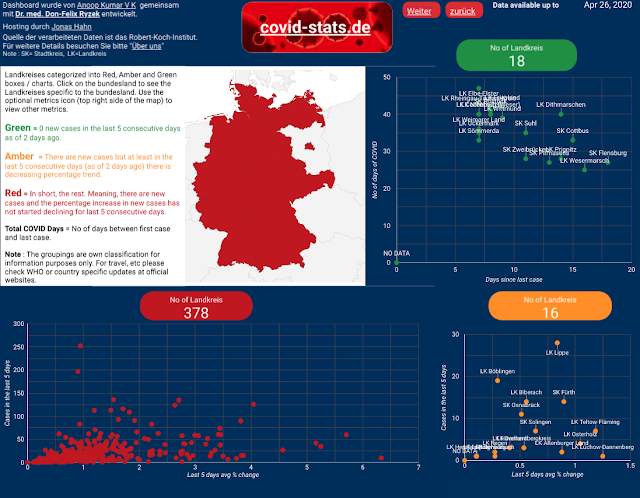
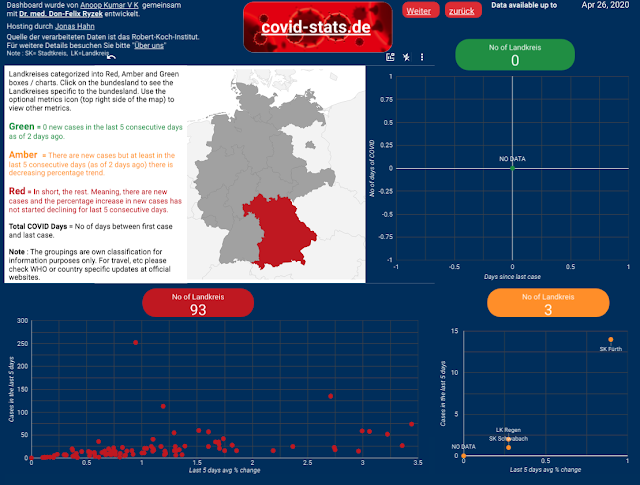
The RAG (Red, Amber, Green) visualization (image 1) is now also added to the covid-stats.de dashboard (page 2). It provides some more interesting information. It provides a quick overview of cities/towns that are coming out of COVID-19 and those that are nearing the end of COVID-19 situation within Germany. By clicking and selecting the bundesland it filters out (image 2) to display the cities/towns of that particular bundesland. Using the optional metrics (icon on the top right of the map) one can also get information about last 5 days total cases (image 3), last 5 days average % change, etc.


Comments
Post a Comment
Thanks for your comment. It will be posted after checks.